NEA Waste Statistics and Recycling Numbers: What the Figures Include
How to read Singapore's NEA waste statistics: what the domestic and national recycling rates actually count, where the measurement point sits, and the gap between the published and real figures.
How To Read <a href="https://www.nea.gov.sg/" rel="noopener" target="_blank">NEA</a> Waste Statistics Singapore: What The Published Numbers Actually Mean
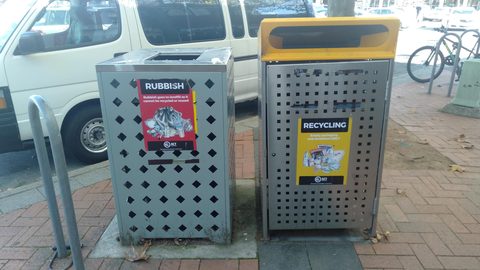
The blue bin outside your HDB block is the most visible recycling infrastructure in Singapore, and the most misunderstood. Every year the National Environment Agency publishes a waste statistics report that gives a household recycling rate of 12 percent and an overall rate of 52 percent. The gap between those two numbers is not a rounding error. It is the difference between what households do and what industrial scrap yards do. This guide explains how to read NEA waste statistics Singapore so you know exactly what each figure counts, where the measurement point is, and why the real household recycling rate is lower than the headline number suggests.
NEA Waste Statistics Methodology: The Measurement Point That Changes Everything
The NEA waste statistics methodology counts material as recycled at the point of collection. When a public waste collector picks up a blue bin, the entire tonnage inside is recorded as recycled. That tonnage is not yet sorted. It has not passed through a materials recovery facility. It has not had contaminants removed. The measurement point is the collection vehicle, not the MRF output gate. This single methodological choice inflates the household recycling rate by approximately the contamination rate. Anything placed in the blue bin, clean paper, greasy pizza box, half-full soft drink bottle, dead textile, counts as recycled the moment the bin is emptied. The 2023 household waste recycling rate of 12 percent represents 1.87 million tonnes of waste generated, of which the collection system designated a portion as recycled. The real post-MRF figure is lower by at least the 40 percent contamination rate that NEA reported for 2023. That puts the actual household recycling rate closer to 7 percent, not 12 percent. The distinction between collection-point accounting and recovery-point accounting is the single most important fact in the entire dataset.
Singapore Household Recycling Rate Definition: What It Counts And What It Misses
The Singapore household recycling rate definition covers waste from homes and trade premises. Trade premises are the shops, hawker centres, coffee shops and small offices in the same collection sectors as HDB flats and condominiums. The denominator is 1.87 million tonnes of waste generated in 2023. The numerator is the tonnage collected via the National Recycling Programme, the commingled blue bins, plus segregated streams collected by the same public waste collectors. The blue bin is a commingled system for paper, plastic, glass and metal. Food waste, liquids, textiles, e-waste, batteries, styrofoam, used tissues, disposable cutlery, light bulbs, ceramics, garden waste and furniture are excluded. They still end up in the bin because the advisory list changes and the bin accepts whatever is dropped into it.
What The Contamination Rate Does To The Household Rate
The NEA reported a 40 percent contamination rate in blue bins for both 2022 and 2023. That means 40 percent of the tonnage collected from blue bins is not recyclable and ends up incinerated. The contamination comes from food residue, liquids, and non-recyclable items placed in the bin. If the household recycling rate is calculated at the collection point as 12 percent, and 40 percent of that tonnage is actually waste, the effective rate after MRF sorting drops to roughly 7 percent. The MRF residual rate, the proportion of incoming commingled material sent to incineration after sorting, is the real recycling loss point. MRF operators report rates that can exceed 50 percent depending on the housing type and collection sector. The gap between the published household recycling rate and the real recovery rate is structural. It will persist as long as the measurement point stays at collection rather than at material recovery.
| Metric | 2023 Value | Measurement Point | What It Actually Measures |
|---|---|---|---|
| Total waste generated | 6.86 million tonnes | Weighbridge at incineration plant or landfill | All waste from all sectors, including industrial and trade premises |
| Total waste recycled | 3.55 million tonnes | Collection point for household; end-processor for non-household | Tonnage counted as recycled at the point of collection for household; material received by recyclers for non-household |
| Overall recycling rate | 52% | Collection point for household; end-processor for non-household | Combined rate across all sectors; dominated by non-household industrial scrap |
| Household waste generated | 1.87 million tonnes | Weighbridge at incineration plant or landfill | Waste from homes and trade premises only |
| Household recycling rate | 12% | Collection point (blue bin or segregated collection) | Tonnage collected from household sources, before MRF sorting and contamination removal |
| Non-household waste generated | 4.99 million tonnes | Weighbridge at incineration plant or landfill | Waste from industrial, commercial and institutional premises |
| Non-household recycling rate | 66% | End-processor (recycler receipt) | Material that reached a recycler; dominated by industrial scrap like metal, construction waste and homogeneous industrial food waste |
| Blue bin contamination rate | 40% | MRF audit (snapshot, not continuous) | Percentage by weight of blue-bin contents that cannot be recycled due to food residue, liquids or non-recyclable items |
| Waste disposed of (incinerated or landfilled) | 3.31 million tonnes | Weighbridge at incineration plant | Waste that enters incineration plants or Semakau Landfill directly |
| Semakau Landfill projected closure | 2035 | Projected at current fill rate | Year when the engineered enclosure reaches capacity; moves with waste generation and ash production |
Overall Recycling Rate Explained: Why The Headline Number Includes Industrial Scrap
The overall recycling rate starts with the denominator: 6.86 million tonnes of total waste generated in 2023. The numerator: 3.55 million tonnes recycled. That gives 52 percent. The non-household sector generated 4.99 million tonnes of that total and recycled 66 percent of it. That non-household rate is dominated by industrial scrap, metal, construction debris, homogeneous industrial food waste like spent grains and soya bean waste. When you see a headline that says Singapore recycles 52 percent of its waste, that number is not about household behaviour. It is about what factories, shipyards and construction sites send to recyclers. The household sector generated 1.87 million tonnes and recycled 12 percent. The overall rate is the weighted average of two very different sectors, and the industrial side pulls the average up. The Zero Waste Masterplan target of 70 percent overall recycling by 2030 requires both sectors to improve, but the household sector's target of 30 percent by 2030 is the harder lift. It depends on reducing contamination in a commingled system that is not designed for source segregation.
How The Non-Household Rate Works
The non-household recycling rate is measured at the end-processor, not at the collection point. A factory that ships scrap metal to a recycler counts that tonnage as recycled only when the recycler confirms receipt. This is more accurate than the collection-point measurement used for household waste. The non-household rate fell from 72 percent in 2022 to 66 percent in 2023, partly because total waste generation dropped from 7.39 million tonnes to 6.86 million tonnes, and the composition shifted. The non-household rate is dominated by a few large streams. Paper and cardboard generated 1.07 million tonnes in 2023 and had a 31 percent recycling rate. Plastic generated 958,000 tonnes and had a 5 percent recycling rate. Food waste generated 755,000 tonnes and had an 18 percent recycling rate that includes industrial streams like spent grains. The plastic recycling rate is the lowest among major streams because Singapore has no large manufacturing base that pulls recyclate through the system. End-markets are overseas and exposed to import restrictions.
NEA Waste Data Report: The Single Authoritative Dataset
The NEA waste data report is the single authoritative dataset for all waste and recycling figures in Singapore. Every tonnage figure in the public domain, government press releases, Zero Waste Masterplan documents, NGO reports, academic papers, traces back to this annual publication. The 2023 edition reports total waste generation of 6.86 million tonnes, total waste recycled of 3.55 million tonnes, and an overall recycling rate of 52 percent. The report breaks down waste by stream: paper and cardboard at 1.07 million tonnes, plastic at 958,000 tonnes, food waste at 755,000 tonnes, textile and leather at 220,000 tonnes, glass at 69,000 tonnes, and e-waste at 71,000 tonnes. The recycling rates for each stream tell a clear story: paper and cardboard at 31 percent, plastic at 5 percent, food waste at 18 percent, textile and leather at 2 percent, glass at 12 percent. The report also gives the household and non-household breakdowns, the contamination rate, and the Semakau Landfill projection. The 2024 data is expected mid-2025.
What The Report Does Not Tell You
The report does not give the real household recycling rate after MRF sorting. It does not give sector-level or housing-type-level figures for contamination or recovery. It does not report the MRF residual rate for individual facilities. It does not trace what happens to a specific item placed in a blue bin from the bin chute to the MRF to the incinerator or recycler. These gaps are the authority gaps in the dataset. The NEA publishes the contamination rate as a snapshot from MRF audits, not as a continuous measurement. The e-waste recycling rate is not separately reported; the Producer Responsibility Scheme for e-waste reports tonnages collected, but the denominator, total e-waste generated, is modelled from sales data and equipment lifespan assumptions, so the rate is a model output, not a direct measurement. The food waste recycling rate of 18 percent includes homogeneous industrial streams like spent grains and soya bean waste. The post-consumer household and hawker-centre rate is in single digits. The report is the best source, but it is not a complete picture.
What The Household Recycling Rate Actually Means For A Home
If you use the blue bin, the household recycling rate of 12 percent does not tell you how much of what you put in the bin gets recycled. It tells you how much tonnage was collected from household sources and counted as recycled at the collection point. The real recovery rate is lower. The contamination rate of 40 percent means that for every 100 kilograms of blue bin contents, 40 kilograms are incinerated. The remaining 60 kilograms go to a materials recovery facility at Sarimbun Recycling Park or elsewhere, where further losses occur. Soft plastics entangle MRF sorting equipment. Textiles wick moisture and contaminate adjacent material. Items of the wrong resin type find no local market. The MRF residual rate, which is not published by NEA but is reported by operators, can add another 10 to 20 percent loss. The real recycling rate for blue bin contents is closer to 7 percent of the tonnage collected, and possibly lower in sectors with higher contamination.
What Happens To A Contaminated Recyclable
Place a greasy pizza box in the blue bin. The box is paper and theoretically recyclable, but the grease contaminates the paper fibres. At the MRF, the box may be sorted into the paper stream, where the grease spreads to adjacent clean paper. The entire batch may be downgraded to low-quality material that no mill will buy. Or it may be rejected and sent to incineration. If the box is wet from food residue, it adds weight that counts as recycling at the collection point but is incinerated after sorting. The same logic applies to a half-full soft drink bottle: the liquid leaks into the bin, contaminating the surrounding paper and cardboard. The bin has no drainage. The NEA excludes liquids from the blue bin. The bin design does not enforce that rule. The failure mode is structural: a commingled system with no source segregation and no enforcement of the acceptance list cannot achieve a high real recycling rate.
The Real Gap: Claimed Versus Real Recycling Performance
The claimed household recycling rate for 2023 is 12 percent. The real rate after MRF sorting and contamination removal is approximately 7 percent. The difference is caused by the measurement point being at collection, not at material recovery. The claimed overall recycling rate is 52 percent. The real rate for household behaviour is the household rate of 12 percent, not the overall rate. The overall rate is routinely cited as evidence of household recycling performance, which it is not. The gap is one of attribution, not measurement error. The Semakau Landfill closure date has been stated as 2035 for over a decade. The actual closure year moves with waste generation and ash production rates. In 2023, 3.31 million tonnes of waste were disposed of, mostly incinerated. The incineration bottom ash, roughly 15 to 20 percent of the original waste mass, is barged to Semakau. The landfill's capacity is not a fixed number but a function of how high the bunds can be raised. The 2035 projection is a directional number, not a hard deadline.
What The Incineration Diversion Rate Actually Means
The claim that only 3 percent of waste is landfilled treats incineration as diversion. The ash from incineration, roughly 90 percent of the volume landfilled at Semakau, is still waste. The real landfill diversion rate is closer to 80 to 85 percent, not 97 percent. The four waste-to-energy incineration plants in operation as of 2026, TuasOne, Tuas South, Keppel Seghers Tuas, and Senoko, reduce volume by up to 90 percent but do not eliminate the residue. The Tuas Nexus integrated waste-and-water facility, with its Integrated Waste Management Facility, is designed to replace Senoko and Tuas Incineration Plants and raise energy recovery efficiency. The first phase is expected operational mid-2020s. The fundamental geography does not change: Singapore incinerates waste because land is scarce, and thermal treatment will remain the backbone of the system. The ash still requires landfill, and that fact is permanent.
How To Use The NEA Waste Statistics Report Yourself
Go to the NEA website and download the latest waste statistics report. The 2023 edition is the most recent as of mid-2025. Look for the tables that break down waste generation and recycling rates by stream. Compare the household and non-household rates. Check the contamination rate. Note the Semakau fill rate projection. The report is a PDF that runs roughly 30 pages. Every number in it is the official figure. If you see a recycling rate quoted in a news article or a policy document, it should trace back to this report. If the number does not match, the source is using a different methodology or the figure is outdated. The report is updated annually, and the schedule is predictable: the data for year X is published in year X plus one. The 2024 data is expected mid-2025. Bookmark the NEA waste statistics page and check it once a year. That single dataset is the only source you need for official waste figures in Singapore.
Common Questions
What is the difference between the household and overall recycling rates?
The household rate counts waste from homes and trade premises only, measured at the collection point before sorting. The overall rate combines household and non-household waste. Non-household waste is dominated by industrial scrap, so the overall rate is always much higher than the household rate.
Where does the NEA publish waste statistics?
The NEA waste statistics report is published annually on the NEA website, typically with a one-year lag. The 2023 data was released in 2024. Every public tonnage figure traces back to this single dataset.
What is the contamination rate in blue bins?
The NEA reported 40 percent for both 2022 and 2023. That means 40 percent of the weight collected from blue bins is not recyclable and is incinerated. MRF operators report rates that can exceed 50 percent depending on housing type and collection sector.
Why is the plastic recycling rate so low in Singapore?
Plastic waste generated was 958,000 tonnes in 2023, but only 5 percent was recycled. Singapore has no large manufacturing base that uses recycled plastic. End-markets are overseas, and contamination makes much of the collected plastic unsuitable for export.